A look at the New Compass platform features that turn citywide mobile-mapping collections into maintenance-ready inventories, illustrated through two recent municipal programs in Norwalk, CT and Fremont, CA.
A citywide sign inventory is one of the most data-intensive deliverables a municipal DOT will ever procure. Tens of thousands of signs, each carrying twenty to thirty attributes, all of them tied to the city’s existing centerline network, and all data expected to integrate cleanly into Cityworks or another asset-management system upon delivery. Additionally, cities need a way to interact with their collected and extracted data to perform further analysis of their complex data deliveries. We built Ranger and Pathfinder to directly meet these needs and ensure the best possible deliverables for cities.
Our mobile mapping partner, Teleqo Tech, handles the field side: their mobile-mapping fleet captures the colorized point clouds and panoramic imagery that every inventory is built from, including 309 centerline miles for the City of Norwalk’s TMP and 612 directional miles for the City of Fremont’s Maintenance Operations group. Once that data is processed, it flows into New Compass’s tools. Here’s a look at the platform features that made those two projects deliverable at scale.
Ranger: extraction that scales without quality drift
Ranger is where raw mobile-mapping data becomes an attributed inventory. A few of the platform capabilities that mattered most on Norwalk and Fremont:
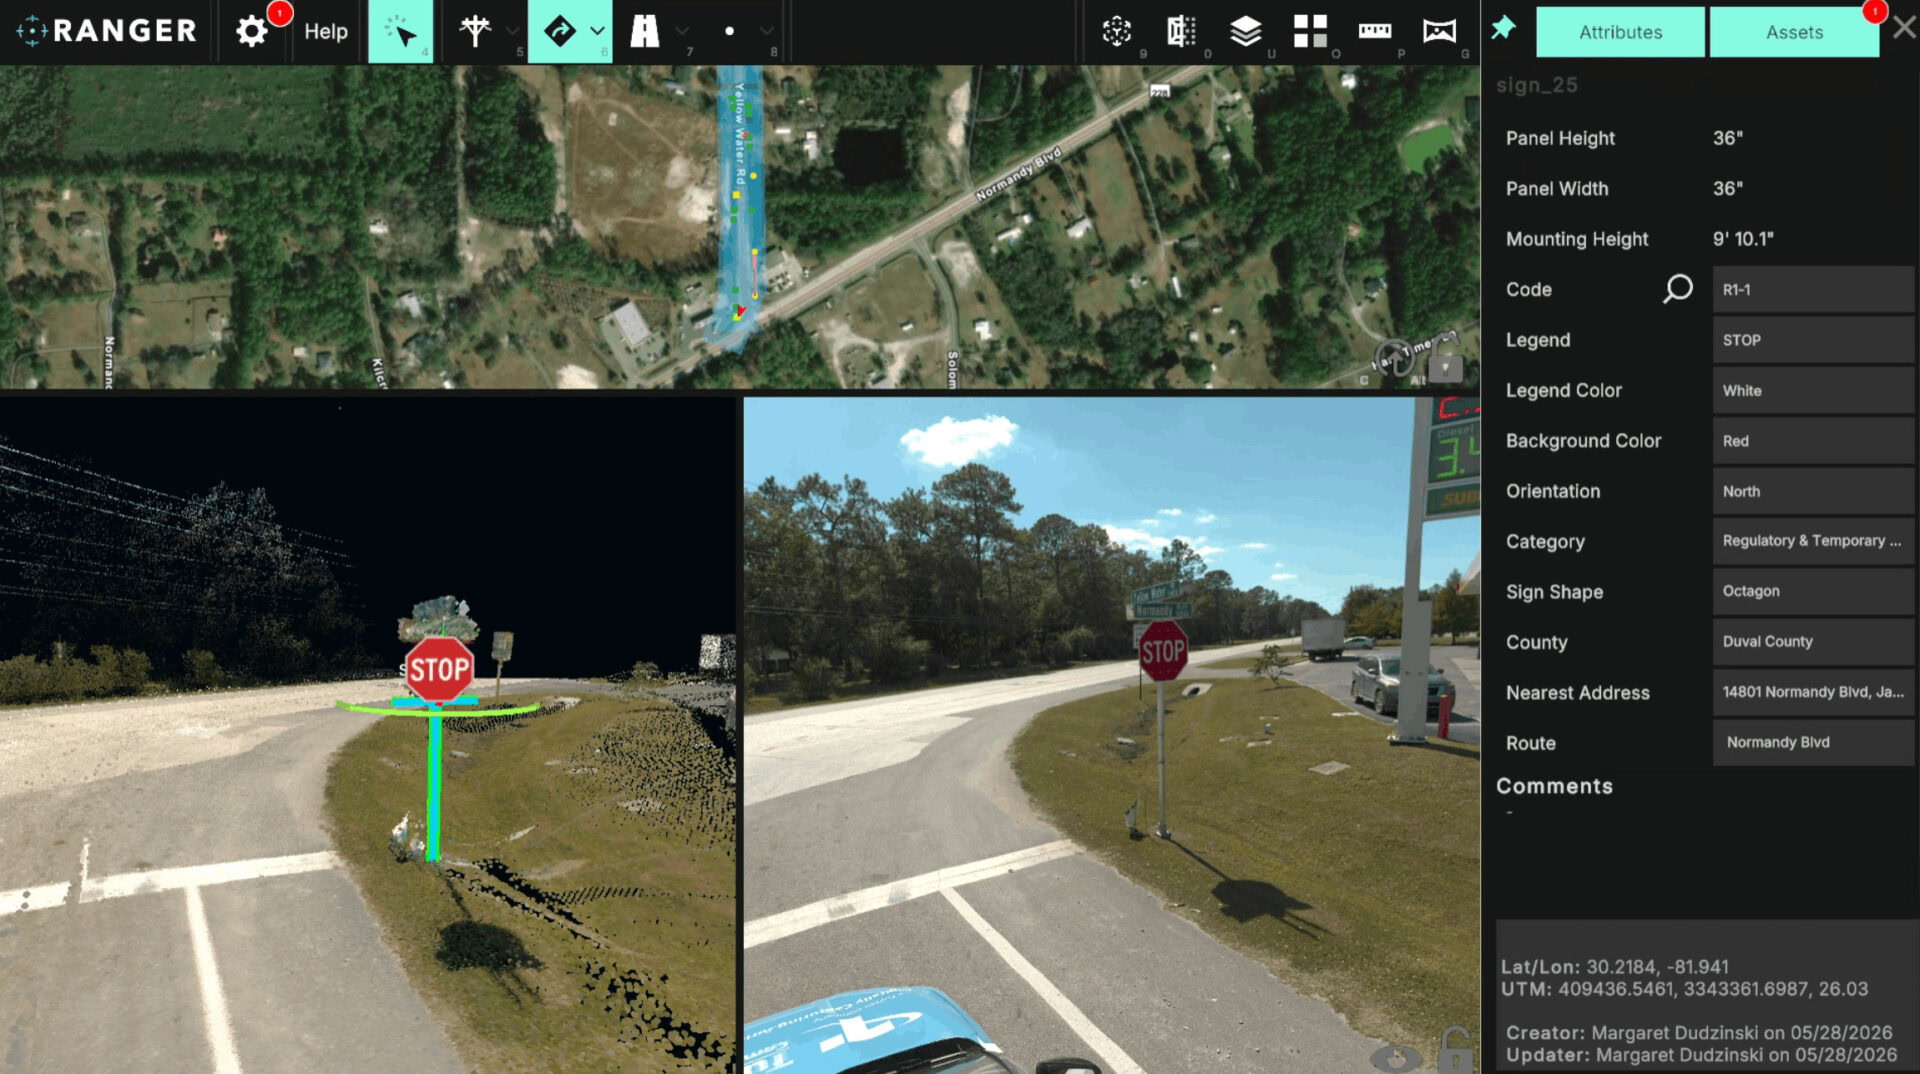
- Dual Panoramic Imagery and Lidar View: Ranger’s unique extraction experience provides both the point cloud and panoramic images to be viewed simultaneously while extracting. For sign extraction, this feature is of the utmost importance. While point cloud provides accurate positional data for extracting sign locations and measurements, the sign faces themselves can often be difficult to read from even well-colorized point cloud. By pairing the point cloud with the associated panoramic imagery, extractors can easily reference both while attributing the sign faces.
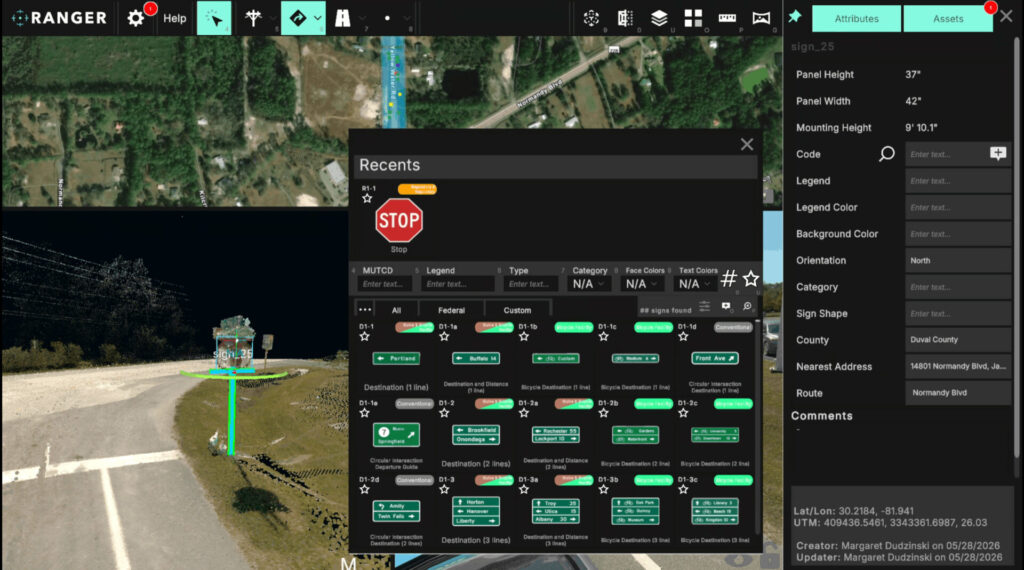
- MUTCD-aware attribute extraction. Ranger ships with a built-in MUTCD code database. When an extractor identifies a sign in the point cloud, they’re prompted to select the corresponding MUTCD code, and the associated information (panel colors, codes, language, shape, dimensions) is automatically pulled into the extraction record. The benefit is twofold: extractors move faster on every common regulatory and warning sign, and the attribution is uniform across the entire dataset, with no manual entry variance to QC against. Non-MUTCD assets like Neighborhood Watch placards, surveillance signs, and city-specific guide signs flow through the same workflow with project-specific dictionaries layered on top.
- Hub-based work management. Citywide inventories are too large to manage as monolithic tasks. Ranger structures every project around neighborhood-scale collection hubs (22 for Norwalk, 28 for Fremont), and every hub can be independently collected, extracted, QC’d, and delivered without the team waiting on the rest of the dataset. On Fremont, that turned a single citywide deliverable into 140 discrete trackable tasks (five workflow phases × 28 hubs), keeping the schedule honest across nine months and tens of thousands of features. Extractors are assigned to specific hubs, project leads track progress hub-by-hub, and partial deliveries are possible whenever a city needs them.
- Relationship-aware feature classes. Signs and sign supports are separate feature classes, but they aren’t independent. Every panel hangs on a support, and supports often carry multiple panels. Ranger maintains that parent/child relationship as data is built, so the resulting geodatabase is structurally correct rather than a pair of disconnected point layers. On Fremont, we added an ArcPro relationship-class validation step before final delivery to confirm the link between every sign and its support.
- ID generation tied to the city’s network. Asset IDs are how a municipal inventory actually integrates with the rest of a city’s GIS. Ranger generates each asset ID by joining the city’s authoritative Street Centerline ID to its own generated asset ID, so every row in the geodatabase references the city’s own roadway network on arrival. For Norwalk, deliverables were conflated against the City’s existing sign location KML to the same effect, so every record carried the correct City Road ID the day it was delivered, with no after-the-fact joining required.
The output Ranger produces is what most cities have never had: 18,581 signs, 2,766 pavement messages, and over 1.4 million linear feet of pavement and lane markings in Norwalk; 33,992 sign panels and 23,501 sign supports in Fremont, each keyed to a street centerline.
Pathfinder: the visualization layer that ships with the inventory
A geodatabase is the right primary deliverable for a municipal client, but it’s not how a maintenance supervisor works day to day. They want to see the asset before dispatching a crew, and they want that imagery available from their desk, not via a truck roll.
Pathfinder is our LiDAR-and-imagery web viewer that provides a seamless delivered product to cities for their asset inventories. In Pathfinder, extracted assets are overlaid with the collected data in a map that allows for quick searching of assets, and additional examination of the collected features.
Using Pathfinder, Norwalk’s TMP staff can open Pathfinder, click on any of the 18,581 signs in their inventory, and directly view the point cloud and imagery that sign was extracted from. They can view the road, make additional measurements, and fully understand the underlying context of the extracted sign, rather than viewing it as a dot in a 2D viewer.
Fremont’s maintenance team gets the same click-through visual record on every sign and support, with the Pathfinder URL stored as an attribute directly on the asset itself. From inside their existing GIS or work-order interface, staff click the link and land on the imagery directly. No separate login, no manual lookup.
The combined effect changes the daily workflow. Resident reports about missing or damaged signage stop being a dispatch problem and become a triage problem: open the asset in Pathfinder, confirm the issue against imagery, generate the work order against the existing record. Replacement planning stops being a from-scratch field exercise and becomes a query against the inventory: filter to Critical condition, sort by neighborhood hub, route the crew.
Why the platform matters for cities at scale
When cities need their sign assets inventoried, they are looking for detailed extraction at scale. They need data formatted in a way that is ready for their asset-management system, with imagery they can review from their desks without additional field visits.
Between Teleqo Tech’s service offerings and New Compass’ software, we show a deep understanding of this need. We built our solutions to directly tackle the complex workflow of delivering asset inventories at a large scale, and in the formats our clients need. We continue to optimize our software solutions to make this process even more streamlined in the future to keep meeting our client’s needs.
If your team is planning a sign inventory program, retro-reflectivity audit, or asset-management standup, we’d like to talk about what Ranger and Pathfinder could do for you. Get in touch with the New Compass team to start a conversation.